22 March 2025
Two plus two equals four. Nothing I say can convince you otherwise. America’s fiscal math is equally true. In 2023, interest payments on the national debt accounted for over one trillion dollars [1]. This is the first time this has ever occurred. This peak followed a rapid rise in rates by the Federal Reserve to combat inflation. Overall, America had a peacetime budget deficit of almost two trillion dollars [2]. Mind you, this is the annual rate at which the debt is growing. Because we take out loans to cover the annual deficit, the size of the interest has grown with the deficit. For years, this was offset by low interest rates, but this changed following the pandemic [3].
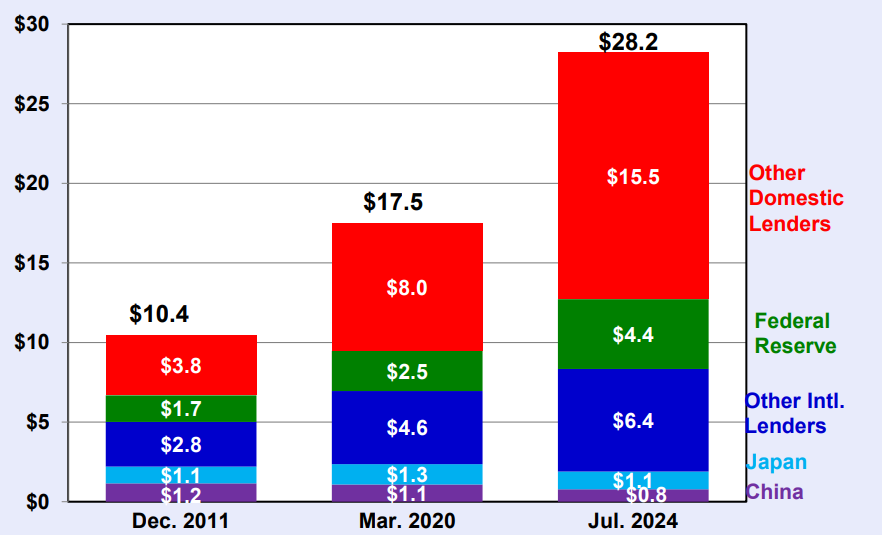
In 2023, Moody’s—one of America’s most famous credit agencies—made headlines by downgrading the United States’ credit risk, reflecting the shift in trust in America’s fiscal health [4]. Consequently, investors are growing more difficult to find. The international share of the debt held by the public—that is mainly Japan, China and other international lenders — has declined from 48 percent to 29 percent between December 2011 and July 2024 [5]. Moreover, the absolute size of the debt has grown substantially. Meaning, the size taken by domestic lenders and the Federal Reserve has grown much faster.
In fiscal year 2024, the United States spent $6.94 trillion while collecting $5.08 trillion in revenue [6]. While we like to throw blame around, as I will detail later, the data is clear that the debt is being driven by spending and not a lack of revenue. As the chart from Jessica Reidl at the Manhattan Institute shows, revenues have consistently remained in the band between 15 percent and 20 percent of GDP [7]. Meanwhile, expenditures have steadily increased since the early 2000s. Tax cuts are largely a Republican action, while spending money tends to be a bipartisan goal—albeit for different prerogatives.

So what are we spending money on? These tables–again from Jessica Reidl–show the major components of the federal budget in FY2024. Simply adding up the largest expenditures gives you a clear picture.

Contrary to common belief, the national debt is not being driven by conflicts in Ukraine or the Middle East, foreign aid, welfare, or government salaries. In fact, Social Security, National Defense, Interest Payments, Medicare, and Medicaid collectively account for 67 percent of spending in the federal budget, meaning any serious consideration of addressing the national debt must include cuts to these programs or revenue increases elsewhere to offset them. Though, as noted above, revenues can only go so high. Some components have shifted over time. Contrary to Democratic thinking, the defense budget is simply dwarfed by the American economy. National security spending as a share of GDP is the lowest since before World War II.

The answer is largely the entitlement programs, Social Security and Medicare. As I will explain below, demographics have prompted an enrollment surge while simultaneously causing a decrease in the workforce ratio required to maintain the fiscal health of the program. Both are pay-as-you-go, meaning they are paid for year-to-year by current tax dollars. This means that contrary to common myth, one’s personal contributions are not set aside to accrue interest or investment growth. Instead, the current payments are used to support the current retirees. Since these can be affected greatly by demographic shifts, the gradual retirement of the Baby Boomer generation (1946-1964) through the 2010s and 2020s is transforming the American taxation structure by reducing the share of the population working and increasing the share retired. The trust funds that supply the programs had gradually attained a surplus overtime as there were significantly more people contributing with the payroll taxes into them then drawing out for decades. This flipped when the Baby Boomers transitioned from being contributors to retirees.
Many Americans have heard about the trust funds running out by a date in the future. The demographic shift I explained above demonstrates the savings that built up within them, and also the shrinkage the funds have witnessed in recent years. This has resulted in rapidly rising outlays for Social Security and Medicare precisely at the same time we are least able to afford them. Moreover, the political popularity of these programs means that any attempts at reforming them is a no-go zone in politics. The following two charts are population pyramids depicting the demographic change. The charts are composed of men on one side, women on the other, with age on the y-axis. Young people are at the bottom and seniors are at the top. The data is from the 1990 U.S Census [8] and the American Community Survey of 2023 [9] respectively.


The national debt has been an issue in American politics for decades. Both sides have developed narratives to blame the other side and easy solutions. President Donald Trump and much of his Republican cohort have blamed foreign aid, the war in Ukraine, and welfare. The President believes that tariffs will address this concern as the new income stream will not only bring the budget back into black but also permit the elimination of income taxes. Democratic thinking has focused on taxing wealthy Americans and businesses as well blaming repeated Republican tax cuts for the debt boom. The President’s viewpoint is simply wrong, as foreign aid was only 1 percent of the budget in FY 2024 [10]. Moreover, the money sent to Ukraine as aid is generally estimated at between $150 and $200 billion in total over three years [11]. Not only a small portion of GDP, but the aid is largely old weapon stockpiles sent for disposal anyway. The quantity is simply valued in dollar terms as an accounting measure. It is not within the discretionary budget. While the Democrat’s narrative is more correct, it is not entirely accurate. Wealthy Americans pay much more in effective taxes as a share of their incomes according to the Pew Research Center [12].
The repeated rounds of tax cuts done by the Republican party when in power have often been cited, but they simply are not the main drivers of the deficit and consequently the debt. To clarify, they did not pay for themselves with enough new revenue to offset the drop in tax rates. So while they made the deficit worse, they are by no means the main drivers of the debt [13]. The reality is the demographic headwinds have transformed Social Security and Medicare into a money monster.
Image via Pexels Free Photos
Works Cited
[1] Sherman, Erik. “The U.S. Passes $1 Trillion Interest on the Public Debt.” Forbes, May 30, 2024. https://www.forbes.com/sites/eriksherman/2024/05/30/the-us-sailed-past-1-t-quarterly-interest-on-the-public-debt/.
[2] McBride, William. “Federal Deficit Grew to $2 Trillion in FY 2023.” Tax Foundation, October 12, 2023. https://taxfoundation.org/blog/federal-budget-deficit-2023/.
[3] Board of Governors of the Federal Reserve System (US), Federal Funds Effective Rate [FEDFUNDS], retrieved from FRED, Federal Reserve Bank of St. Louis; https://fred.stlouisfed.org/series/FEDFUNDS, March 11, 2025.
[4] Barbuscia, Davide, and Andrea Shalal. “Moody’s Turns Negative on US Credit Rating, Draws Washington Ire.” Reuters, November 10, 2023. https://www.reuters.com/markets/us/moodys-turns-negative-us-credit-rating-draws-washington-ire-2023-11-10/.
[5] Riedl, Jessica. “2024 Chart Book Examines Spending, Taxes, and Deficits.” Manhattan Institute, November 12, 2024. https://manhattan.institute/article/2024-chart-book-examines-spending-taxes-and-deficits.
[6] Riedl, Jessica. “2024 Chart Book Examines Spending, Taxes, and Deficits.” Manhattan Institute, November 12, 2024. https://manhattan.institute/article/2024-chart-book-examines-spending-taxes-and-deficits.
[7] Riedl, Jessica. “2024 Chart Book Examines Spending, Taxes, and Deficits.” Manhattan Institute, November 12, 2024. https://manhattan.institute/article/2024-chart-book-examines-spending-taxes-and-deficits.
[8] U.S. Census Bureau. “1990s National Population Estimates.” U.S. Census Bureau. Accessed March 4, 2025. https://www.census.gov/data/tables/time-series/demo/popest/1990s-national.html.
[9] U.S. Census Bureau. American Community Survey 5-Year Estimates, 2023. United States Census Bureau, 2024. Data.census.gov. Accessed February 22, 2025.
[10] DeSilver, Drew. “What the Data Says About U.S. Foreign Aid.” Pew Research Center, February 6, 2025. https://www.pewresearch.org/short-reads/2025/02/06/what-the-data-says-about-us-foreign-aid/.
[11] Javaid, Maham, Amaya Verde, and Adam Taylor. “Visualizing Ukraine’s Military Aid After the U.S. Freeze.” The Washington Post, March 11, 2025. https://www.washingtonpost.com/world/2025/03/11/ukraine-trump-aid-europe/.
[12] DeSilver, Drew. “Who Pays, and Doesn’t Pay, Federal Income Taxes in the U.S.?” Pew Research Center, April 18, 2023. https://www.pewresearch.org/short-reads/2023/04/18/who-pays-and-doesnt-pay-federal-income-taxes-in-the-us/.
[13] Riedl, Jessica. “2024 Chart Book Examines Spending, Taxes, and Deficits.” Manhattan Institute, November 12, 2024. https://manhattan.institute/article/2024-chart-book-examines-spending-taxes-and-deficits.
